Workbench User Interface
The MIKE Workbench has an IDE-style user interface (UI) where all windows reside under a single parent window, referred to as the Shell.
The Shell contains dockable and collapsible child windows, tabbed windows and splitters for resizing of child windows.
There are four types of windows available: Explorers, Toolbox, Data views, and a Property control. The Toolbox and Property control are Shell controls that are always available, whereas the available Explorers and Data views depend on the system configuration of the Workbench.
The default windows docking configuration is displayed below, but the use may change this.
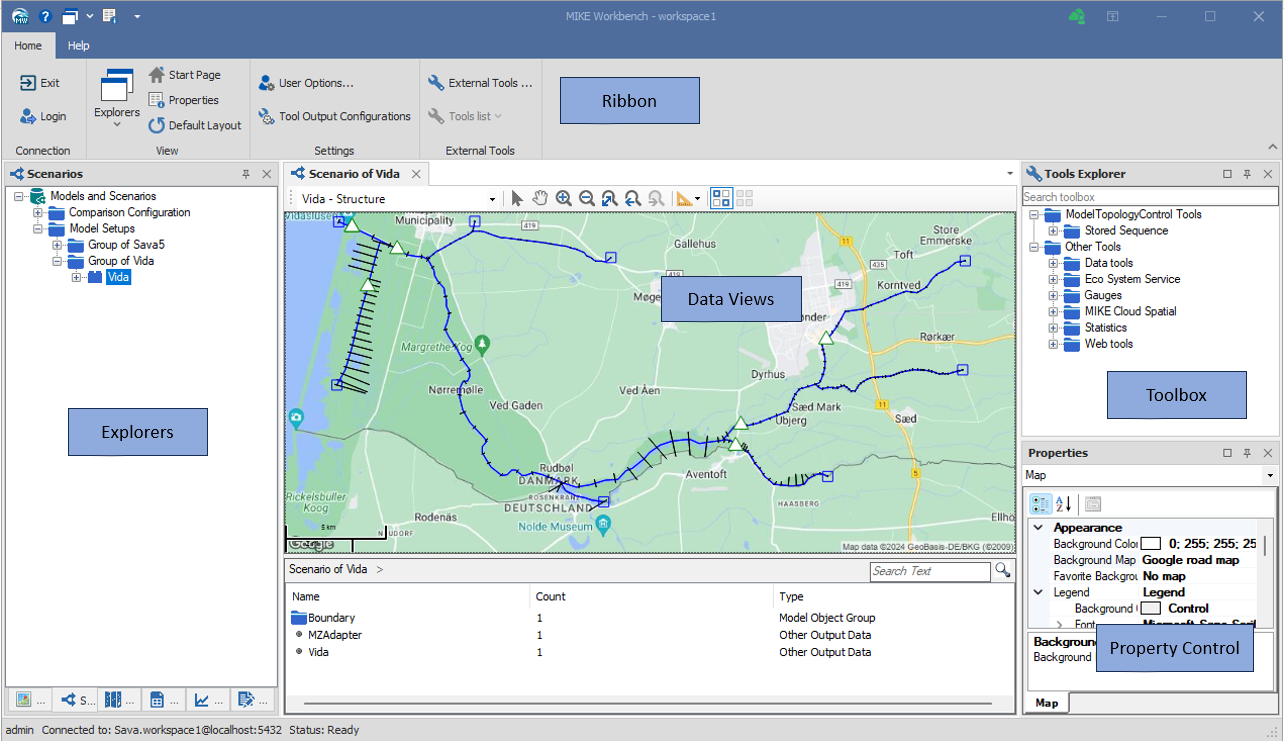
The MIKE Workbench is based on a plug-in architecture where content and functionality is added to the shell by loading one or more so-called Managers. Each manager may add one or more Explorer and/or Data views to the shell. Moreover, each manager may also supply a number of tools to the toolbox.
Explorers
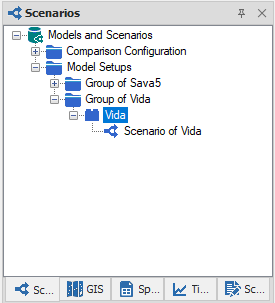
Explorers are supplied the Managers that has been loaded into the system.
Each manager may add any number of explorers to the Shell, but typically a manager will add one or two Explorers.
Explorers are often used to retrieve all, or a subset of the data entities owned by the manager from the database.
The exact functionality will vary from manager to manager, and there are no rules defining what an Explorer should do.
By default, the explorers are docked in the left-hand side of the shell. If more than one explorer has been loaded, they will by default be grouped in a tab control.
The user may change this configuration by dragging and dropping either the individual tabs, or the entire tab control.
Data Views
In the default configuration, data views are located in the center of the application. Several data views may be opened and docked in many different configurations
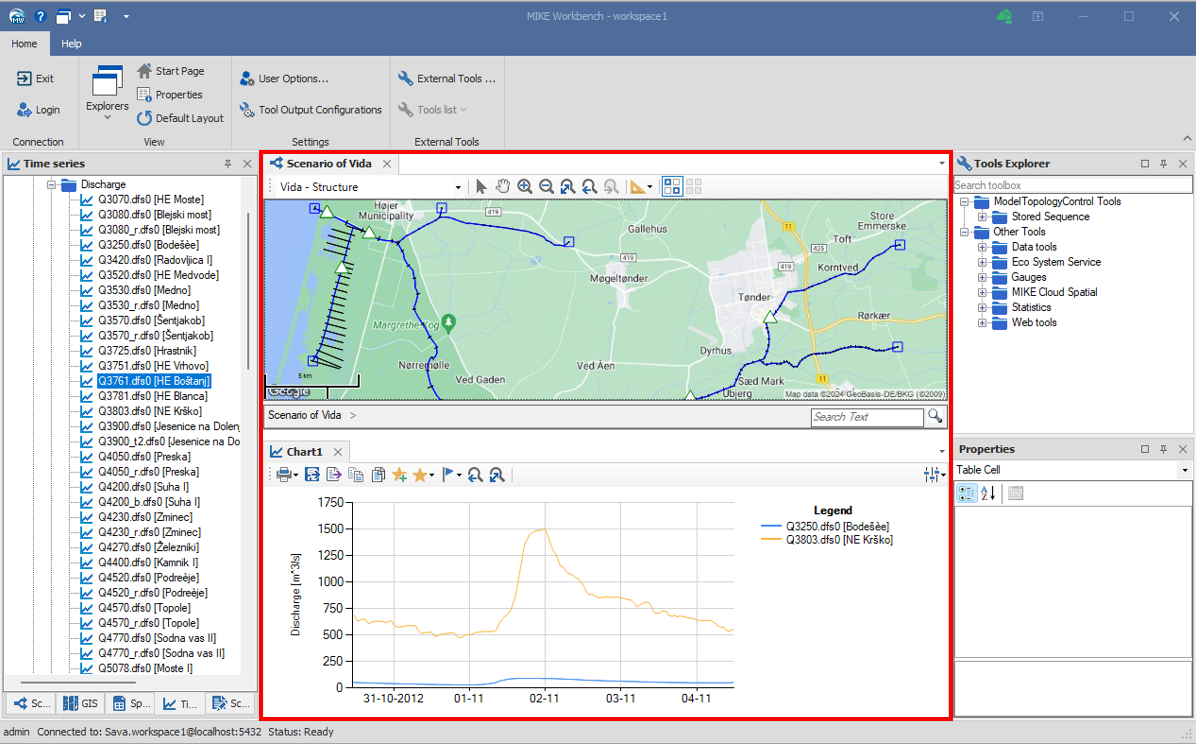
The data view can be rearranged by drag dragging the data view tabs to the location indicators that appears when dragging, as illustrated below.
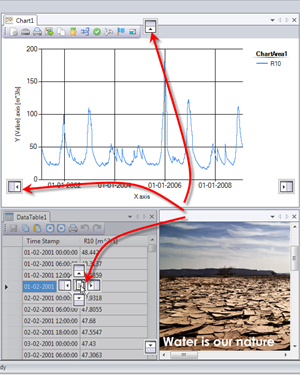
In the example above, the data views have been arranged in three so-called tab groups. The data view tab context menu has 4 entries:
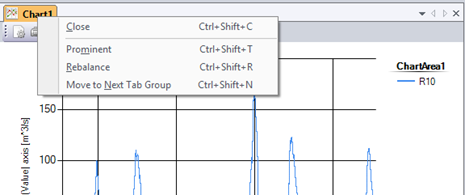
- Close: Will close the data view.
- Prominent: This will maximize the tab, and hide all other data view tab groups.
- Rebalance: This will bring back all other data view tab groups.
- Move to next tab group: Moves the tab to the next tab group.
Property control
When a user interface entity or tool is selected, the corresponding properties are displayed in the Property control. The properties can be edited, and changes will be applied instantaneously with no explicit save operation required.
Toolbox
Tools are components for analyzing and processing selected data entities (such as time series or map layers). Tools are presented in a context sensitive manner in the Tools Explorer, e.g., time series relevant tools are made available only when time series are selected in the Time series explore and GIS tools are only presented when map layers are selected in GIS Explorer.
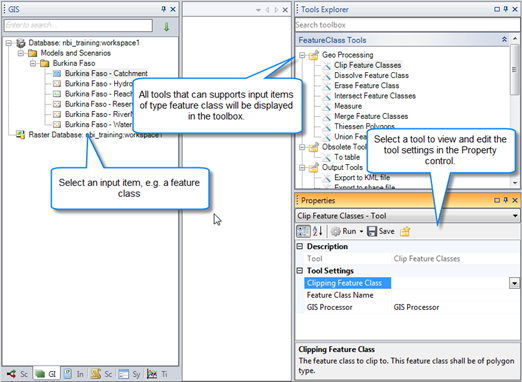
Editing tool settings
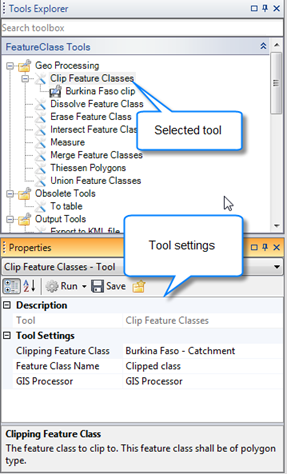
When a tool has been selected in the Tools explorer, the tool settings will appear in the Property control. The settings of the tool can be edited the same was as the properties of any other entity, and changes will be applied instantaneously with no explicit save operation required.
Saving tool settings
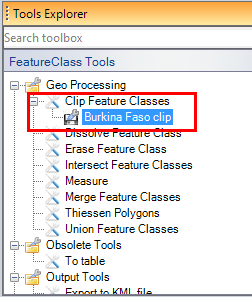
After configuring a tool, the settings can be saved for later use. This is done by clicking on the Save button in the property control.
After saving, the saved tool settings will be represented as a new node under the tool node.
Notice that the saved tool represents the settings, not the input items, and hence a saved tool can be executed on any supported input items.
To run a saved tool, simply select it in the toolbox.
Running a tool
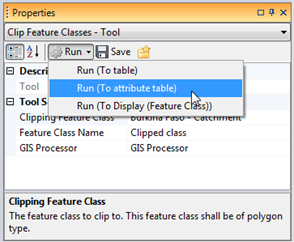
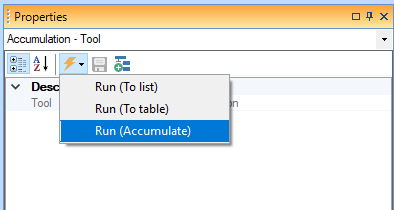
After configuring a tool it can be executed by clicking the "Run" button in the Property control toolstrip.
When clicking the button, a list of available output tools will be listed. Each output tool represents one possible way to visualise or save the result of the tool execution.
Select the appropriate output tool to execute the tool.
Tool sequences
Pending
Tool Output Configurations
Tool Output configurations are additional output when running tools.
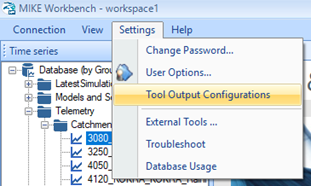
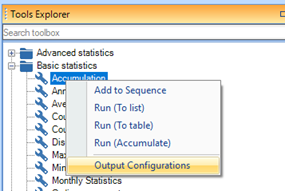
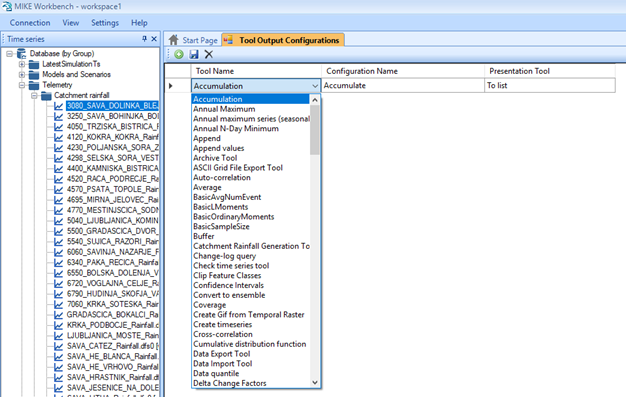
-Tool Name: The name of the tool that the output configuration should be available for.
-Configuration Name: The name of the tool output configuration.
-Presentation Tool: Select the presentation tool to use for displaying the result.
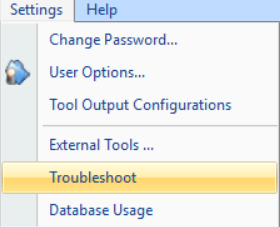
Trouble Shoot
The Trouble Shooting wizard helps the user of MIKE OPERATIONS to configure the system and to solve known configuration issues.
Rule
A number of rules has been made to help the administrator of MIKE OPERATIONS to solve common configuration issues.
Click the "Analyse all" button to make the wizard search for various configuration issue.
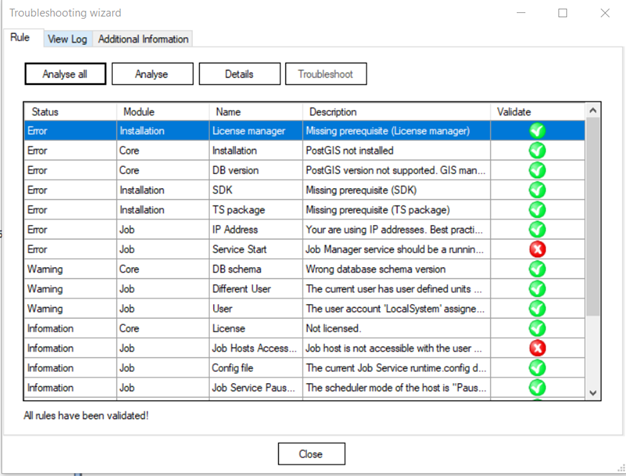
If the rule is valid, the green icon will be shown ( for rules passed successfully
(i.e. no issue was detected).
A red icon means the system has an issue. The button Details will give more information regarding the selected rule,
including how to fix it. The button Troubleshoot will help in this process.
for rules passed successfully
(i.e. no issue was detected).
A red icon means the system has an issue. The button Details will give more information regarding the selected rule,
including how to fix it. The button Troubleshoot will help in this process.
View Log
MIKE OPERATIONS logs various issues and errors when they occur.
Click the links to open log locations.
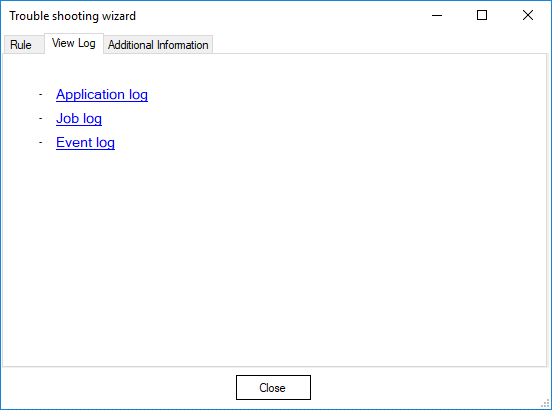
Application Log
Opens the Windows Explorer, displaying the folder where the log of the current user can be found %temp%\dhidss.
Go here to find crash reports and the exceptions caused by invalid data and application behavior.
Job log
Opens the folder where logs written by the job manager can be found in c:\Windows\Temp.
Go here to find logs of failing jobs.
Event log
The Windows Event Viewer displays monitoring and troubleshooting messages from windows and other programs.
Additional Information
This tab contains links to additional information provided by DHI.
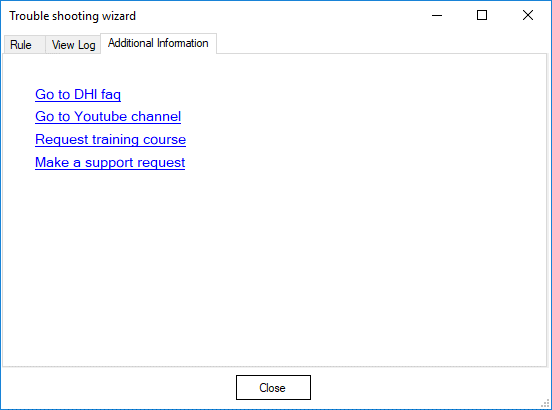
- DHI FAQ Will display the DHI FAQ page.
- YouTube channel Will open the DHI YouTube channel, containing various videos about DHI projects and software.
- Request training course Link to DHI Academy, where information about training, research, papers and on how to contact DHI can be found.
- Make a support request Send a mail to MIKE Support for help on solving an issue in a DHI software product.
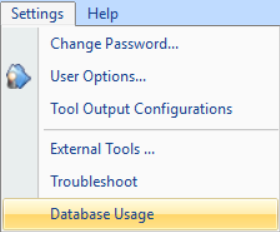
Database usage
The Database usage wizard helps the user of MIKE OPERATIONS to monitor how the database storage is being used. This provides useful insight when doing database maintenance as it shows what are the items that take the most space on the disk.
Database usage
The table shows information about each MIKE OPERATIONS database table. On top of the table size and the number of entries (rows), several details are shown, such as the module it belongs to, the API Namespace it refers to, the name of the entity.
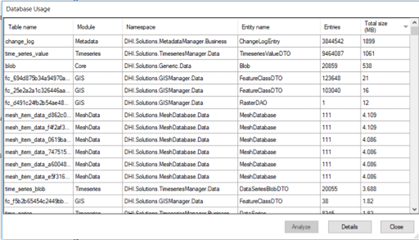
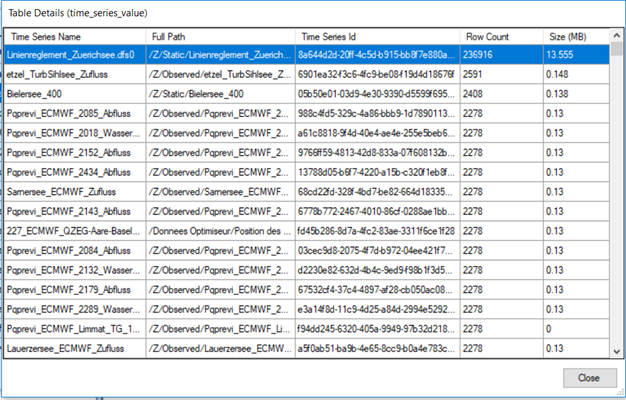
Table details
Some tables can be investigated further.
time_series_value:
For all time-series that are not stored as blobs, the actual time steps are stores in the table time_series_value. The size of table reflects all the time steps of all such timeseries. Clicking "analyse" allows the user to investigate the size of individual timeseries in the database.
blob
Blobs are binary objects that are stored in the database. In a MIKE OPERATIONS context, those can be various types of data like: model objects, model result file, model folder, model initial conditions, spreadsheets, documents from Document Manager, report templates, etc.
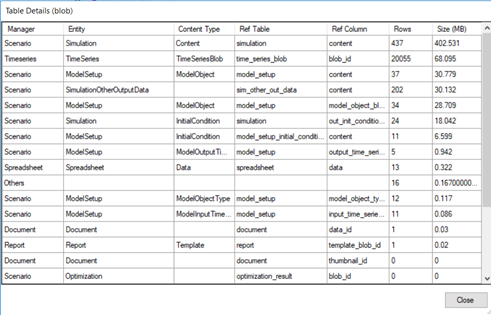
Clicking the Analyse button will help the user understand which manager is using this table and how.